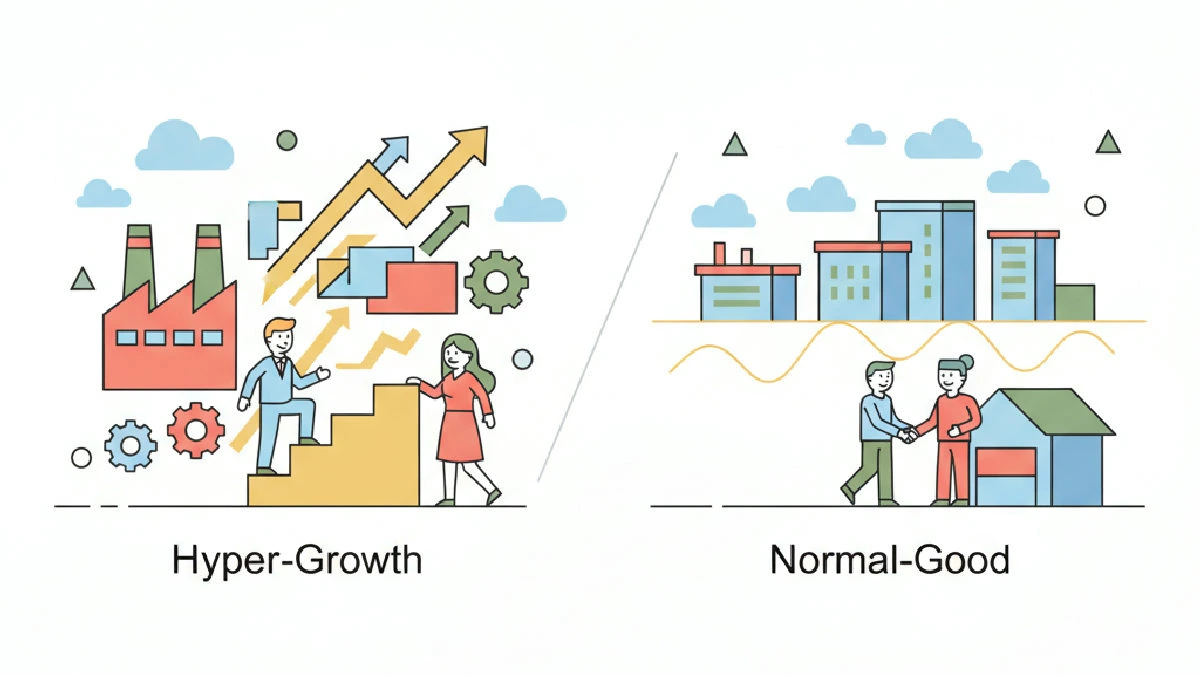
Industrial: From Hyper‑Growth To Normal‑Good
Two numbers capture the moment perfectly: net absorption hit 752 million square feet in 2021 — the most in recorded history — then collapsed to just 129 million square feet in 2025. And yet, NAIOP forecasts 346 million square feet of absorption in 2026, construction deliveries are falling to an eight-year low of 200 million square feet, and Q1 2026 leasing activity is tracking toward what could be an all-time annual record.
The industrial sector has completed its post-pandemic hangover. What comes next is not a return to hyper-growth, but something arguably more valuable for long-term investors: a fundamentally sound market, with normalized demand, a collapsing supply pipeline, and a set of structural tailwinds — e-commerce, nearshoring, automation, and data center spillover — that are, if anything, more durable in 2026 than they were in 2020. The story has shifted from momentum trade to conviction hold.
From Boom to Recalibration: What the Data Actually Shows
The pandemic-era industrial boom was extraordinary by any historical measure. Between 2020 and 2023, the U.S. industrial market absorbed an unprecedented volume of space as e-commerce penetration surged, supply chains were restructured, and retailers built inventory buffers they had never needed before. Net absorption hit 752 million square feet in 2021 and 622 million square feet in 2022, according to NAIOP’s Industrial Space Demand Forecast — levels that dwarfed anything the sector had seen before.
Developers responded accordingly, delivering 530 million square feet in 2022 and 580 million square feet in 2023, according to Cushman & Wakefield. That supply wave ran directly into a demand reversal. As consumers returned to stores, e-commerce growth normalized, retailers right-sized their inventories, and the freight recession that began in 2023 suppressed new leasing decisions. By 2024, net absorption had fallen to just 171 million square feet — the lowest since 2011 — and the ratio of absorption to deliveries fell to just 33%, down from 170% at the 2021 peak.

The recovery is underway. CBRE reported Q1 2026 leasing of 249.8 million square feet — up 14% year-over-year — putting the full year on pace for a potential record. JLL similarly recorded 145.2 million square feet of leases in Q1 2026, up 17.8% year-over-year, with 71.6% of those being new leases rather than renewals. Net absorption reached 50.9 million square feet in Q1 alone, according to JLL — exceptional strength for what is historically the weakest quarter of the year.
Vacancy: A Tale of Two Markets
The national industrial vacancy rate tells an incomplete story. At 6.7% per CBRE and 7.5% per JLL in Q1 2026 — with CoStar projecting a peak near 7.8% before declining through 2027 — the headline number looks manageable but not tight. Digging beneath the surface reveals a market that has bifurcated sharply by asset size, vintage, and location.
Big-box logistics facilities of 500,000 square feet or more — the primary victim of the pandemic supply wave — carry vacancy near 10.9%, the highest in the segment since 2006, per CoStar. In contrast, small-bay industrial properties under 100,000 square feet run at 6.4% vacancy nationally, and infill last-mile locations near major population centers run closer to 4.6%, per Kidder Mathews. Data-center-adjacent industrial sits at roughly 2.1%. The sector is not one market. It is four or five different markets stacked on top of each other, and the vacancy figures that matter most to investors depend entirely on which one they are in.

The geographic dimension is equally important. CoStar noted that large-format industrial vacancy is declining in markets with constrained land — Los Angeles, New Jersey, Chicago — while continuing to rise in markets where speculative development ran hottest: Phoenix, Dallas-Fort Worth, Austin, and parts of the Inland Empire. Phoenix and Austin in particular have seen meaningful small-bay supply additions, pushing vacancy in those submarkets above the national average even in the usually tight sub-100,000-square-foot segment.
Rent Growth: Still Positive, But the Math Has Changed
Rent growth is the central debate in industrial right now. The sector delivered a 53% cumulative increase in national average asking rents between 2019 and 2025, according to Cushman & Wakefield. In absolute terms, national average asking rents stand at $10.18 per square foot as of Q4 2025, up 1.5% year-over-year — and JLL reported a 0.8% year-over-year gain to $10.34 per square foot in Q1 2026, the first positive print since 2024.

The nuance is in the size segments. CoStar’s Q1 2026 data showed that large-format leases (50,000+ square feet) saw asking rents fall 2.7% year-over-year, reflecting surplus supply in that category. Mid-size space (25,000–50,000 square feet) was largely flat. Only small-bay space (under 25,000 square feet) continued growing, at less than 1% — a meaningful deceleration from the 5.5% compound annual growth rate of the prior four years. For tenants, particularly large logistics users, the concession environment has never been better. For landlords, the pricing power is gone at the top of the size range and holding only in the tightest segments.
“The speculative cycle is over and the absorption cycle is starting. Pricing power is shifting back, selectively, to landlords with quality product in infill locations — not to those with undifferentiated big-box in oversupplied markets.”
— HB Capital Real Estate, Industrial CRE Q1 2026 Market Report
The Supply Collapse Is the Story
The single most important chart in industrial real estate right now is not vacancy or rent growth. It is construction starts. After developers broke ground on a combined 1.1 billion square feet between 2022 and 2023, starts collapsed. Cushman & Wakefield reported that deliveries fell to 281 million square feet in 2025 — a 35% drop from 2024 and the lowest annual total since 2017. Marcus & Millichap’s 2026 Industrial Outlook projects completions of just 200 million square feet in 2026, which would be the lowest delivery year in eight years and below the pre-pandemic annual average of approximately 240 million square feet.

This supply dynamic creates a mechanical path to vacancy improvement. If absorption holds at or above NAIOP’s 346 million square foot forecast for 2026 — itself a conservative projection given Q1’s pace — the market absorbs more space than it delivers for the first time since 2022. The vacancy peak CoStar is projecting at 7.8% by year-end would be followed by a multi-year tightening cycle, particularly in segments and geographies where new supply is structurally constrained.
“With vacancy stabilized and new supply slowing, the industrial market is entering 2026 from a position of strength. Tenants are placing greater emphasis on long-term efficiency and reliability, favoring newer facilities in markets tied to population growth and manufacturing investment.”
— Jason Tolliver, President of Logistics and Industrial Services, Cushman & Wakefield
What Actually Moves the Needle With Industrial Tenants in 2026
The spec stack — the set of physical building attributes that institutional tenants use to evaluate space — has evolved significantly from the pre-pandemic era. Brokers and occupiers are now prioritizing a different set of criteria than they were even three years ago.
1. Power: The New Highway Access
Electrical capacity has emerged as the most consequential site selection factor in the industrial market, according to Prologis’ Bold Predictions for 2026. A traditional warehouse was built with approximately 2,000 amps. Modern automated facilities can require 4,000 amps or more, and advanced manufacturing tenants — defense contractors, battery manufacturers, data-center-equipment producers — may require 8,000 to 11,000 amps, according to JPMorgan Asset Management’s industrial portfolio analysis. Fully automated facilities use three to five times more power than a 2024-vintage baseline warehouse. The result: buildings with secured, high-capacity power connections command rent premiums of 20% to 40% over competing product, per JPMorgan. In some markets — the San Francisco Bay Area, where only 2% of substations have available firm capacity — power is not a nice-to-have. It is a gating factor. Properties without clear grid access are effectively undevelopable for advanced users.
“Power is no longer just a spec item. It’s a primary location filter. We’re eliminating sites in the earliest stages of due diligence based on grid capacity, reliability, and long-term rate volatility — before we even look at the building.”
— Voit Real Estate Services, Access to Power: The New Priority for Industrial Site Selection, January 2026
2. Dock Doors and Truck Court Depth
For distribution users, dock-door count and configuration remain critical. Modern logistics tenants require one dock position per 5,000 to 10,000 square feet of building area, with cross-dock configurations preferred for throughput-intensive operations. Standard dock height sits at 48 to 52 inches above grade to align with semi-trailer beds, and minimum truck court depth is 120 feet for standard semi-trailer maneuvering. Buildings that fall short of these thresholds face meaningful discounts and restricted tenant universes. A 9-by-10-foot door opening has become standard, per WAKECO’s 2026 distribution center analysis. Insulated, sectional dock doors — not just roll-ups — are now expected by institutional-quality tenants for energy efficiency and temperature-sensitive cargo.
3. Trailer Parking: The Most Underestimated Spec
Cushman & Wakefield’s tenant surveys have consistently found that trailer parking availability is the most common unmet need among industrial tenants. The standard requirement is a minimum of one trailer parking stall per dock door, with high-turnover cross-dock operations requiring additional staging capacity. Buildings that cannot accommodate adequate trailer storage — typically because of constrained sites or legacy parking ratios — are functionally impaired for large 3PL and retail distribution users. In infill markets where land is scarce, trailer parking ratios often determine deal feasibility more than clear height or floor load.
4. Clear Height and the 36-Foot Standard
The clear height threshold has moved. Institutional tenants now require a 32- to 36-foot minimum for bulk distribution, with 40-foot clear height becoming the standard for new premium product. Buildings at 24 to 28 feet — which represent a large portion of the pre-2010 stock — face a restricted tenant universe, higher vacancy, and meaningful capital investment requirements to remain competitive. This functional obsolescence dynamic is one of the key drivers of the flight-to-quality trend that JLL and CBRE both cited as a primary force behind Q1 2026’s strong leasing activity: tenants are not just taking space, they are upgrading out of older facilities into modern ones.
5. Infill Location: Scarcity as a Moat
Last-mile delivery requirements tied to population density — not population growth — are sustaining demand for well-located infill industrial even as big-box absorption slows. According to MSCI Real Capital Analytics data from Q3 2025, infill industrial assets — defined as within 10 miles of major population centers — traded at a 40-to-60 basis point cap rate premium over comparable suburban product, reflecting investor recognition of the structural supply constraint. JLL’s Q4 2025 data showed small-bay infill vacancy running 200 to 400 basis points below large-format industrial in most Sun Belt submarkets. Link Logistics estimates that every $1 billion in e-commerce sales generates approximately 1.2 million square feet of additional industrial demand, and that demand concentrates in locations that can support rapid last-mile fulfillment.
“Small bay infill warehouse properties are running at 5.5 to 6% availability nationally. These are the hardest assets to develop due to land scarcity and entitlement challenges — which has limited new supply and kept vacancy consistently below the national average for years.”
— Link Logistics, Is the Industrial Real Estate Market Tightening?, May 2026
Long-Term Fundamentals: The Structural Case Is Intact
E-Commerce: Baseline, Not Tailwind
E-commerce penetration has returned to its pre-pandemic trendline after the pull-forward demand of 2020–2021, but that trendline is still upward. Institutional Real Estate, Inc.’s Q1 2026 Light Industrial Market Update confirmed that e-commerce requires approximately three times more logistics space than traditional brick-and-mortar retail to support inventory storage, fulfillment, and last-mile delivery. Prologis’ 2026 forecast projects that e-commerce’s share of new industrial leasing will rise nearly 25% in 2026, and roughly 75% of shoppers now expect two-day delivery — a consumer expectation that cannot be met without a dense network of well-located logistics facilities. Every incremental billion dollars of e-commerce growth generates approximately 1.2–1.25 million square feet of new warehouse demand.
Nearshoring and Reshoring
According to the Reshoring Initiative’s 2024 Annual Report (including Q1 2025 data), reshoring and FDI job announcements continued at record pace, with manufacturing investment in Mexico and the U.S. Sun Belt accelerating year-over-year. A Capgemini Research Institute survey found that 56% of executives are currently planning nearshoring or a combined reshoring/nearshoring strategy. The Southeast U.S. remains the most competitive region for manufacturing investment, favored for its costs, infrastructure, and right-to-work environment. Industrial leasing in the Southeast was repeatedly cited by JLL’s 2026 Industrial Outlook panel as the strongest regional performer, driven by population growth, onshoring, and nearshoring combined.
Data Center Spillover
AI infrastructure build-out is creating a structural and largely untracked source of industrial demand. Link Logistics research estimates approximately 2 million square feet of spillover demand per gigawatt of data center construction, from companies that construct, maintain, and supply data center infrastructure and need nearby warehouse space. A second, stickier user group — companies that maintain racks, servers, and parts — typically locates within close proximity to those facilities permanently. As data center construction accelerates, this spillover demand is showing up in markets like Northern Virginia, Phoenix, Dallas, and Columbus that have strong data center pipelines but limited adjacent industrial supply.
Investment Market and Cap Rates
Industrial cap rates have stabilized after a volatile repricing cycle. First American’s Industrial Potential Cap Rate Model placed the national industrial cap rate at approximately 6.2% in Q4 2025, slightly above the model’s 6.0% fundamental support level — meaning fundamentals support marginally lower cap rates than the market is currently pricing. CRED iQ’s CMBS conduit data showed rates hitting a trough of 5.52% in Q3 2025 before expanding sharply in Q4. Prime infill logistics in markets like Los Angeles and New Jersey trade at 4.50–5.50%, per multiple broker consensus surveys. Marcus & Millichap noted that industrial investment sales volume in 2025 stayed 19% above the 2014–2019 annual average despite being down significantly from the 2021 peak. The institutional conviction behind the asset class has not wavered; only the price has reset.
“Industrial remains the most defensible sector in CRE, but the days of buying yield compression are behind us. Returns in 2026 will be driven by operational execution — rent growth, occupancy management, and capital improvements — not cap rate tailwinds.”
— CRED iQ, Have Industrial Cap Rates Hit a Ceiling?, March 2026
The Checklist: 5 Questions for Industrial Operators and Investors in 2026
- Does the building’s power capacity support today’s tenant requirements — and can it be upgraded without prohibitive cost or timeline? A building that cannot support 4,000+ amps is functionally obsolete for a growing share of the industrial tenant universe.
- Is the trailer parking ratio adequate for the intended use, and is there land to expand it? Cushman & Wakefield tenant surveys consistently identify trailer parking as the most common unmet need. Deals have failed over this spec alone.
- What is the clear height, and does it meet the 32–36-foot minimum for modern bulk distribution? Buildings below this threshold face a restricted tenant universe and higher capex requirements to remain competitive.
- Is the location positioned for last-mile demand, or does it depend on big-box logistics tenants in a market with meaningful surplus supply? Infill and small-bay assets within 10 miles of population centers are structurally tighter. Suburban big-box in Sun Belt oversupply markets is a different underwriting conversation entirely.
- What is the basis relative to replacement cost, and does the cash-on-cash return work today — before any rent growth assumptions? With cap rates at 6.0–6.5% and rent growth near 1%, the underwriting discipline that worked in 2019 applies again: buy income, not projection.
Final Take
Industrial has moved from the easiest trade in commercial real estate to a normal, fundamentally driven market — which is exactly what a mature asset class should look like. The hyper-growth era overstated demand, overbuilt supply, and compressed cap rates to levels that left no margin for error. The correction was sharp but is now largely complete. What emerges on the other side is a sector with genuine structural demand drivers, a supply pipeline that is falling to multi-year lows, and a bifurcated market where differentiation — by location, size, vintage, and infrastructure — determines outcomes more than the macro tide. The operators and investors who understand that distinction are the ones who will capture the next cycle’s returns.