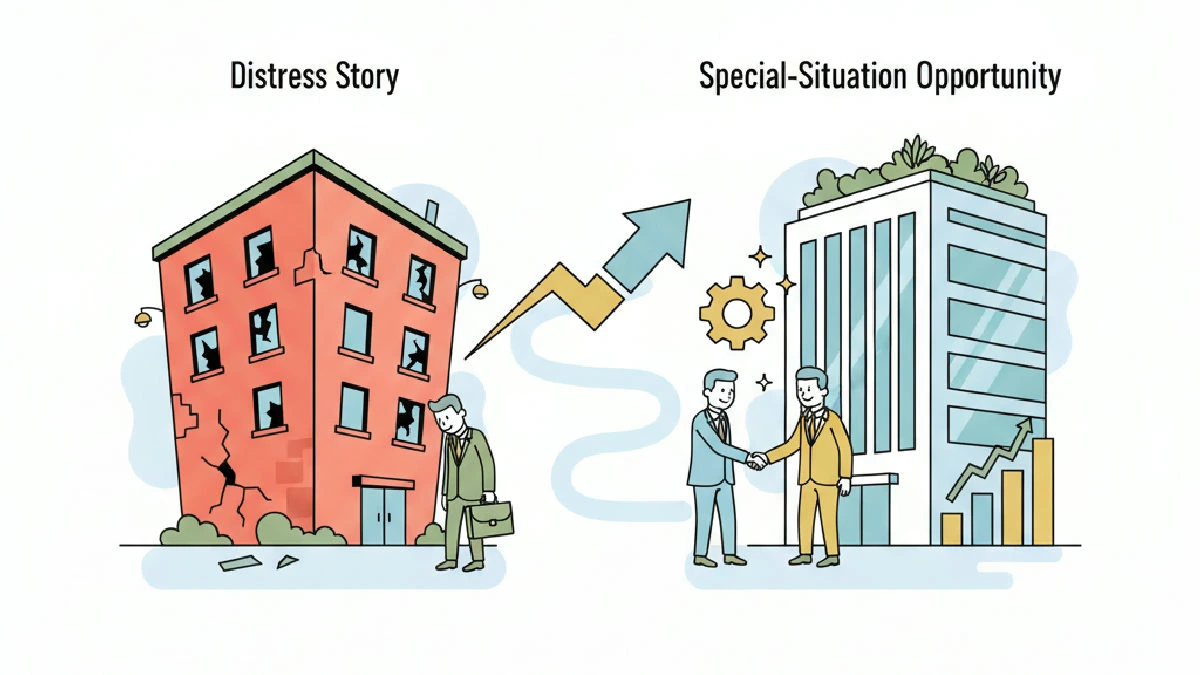
Two eye-opening numbers frame the trade: office property values have fallen roughly 38% from their 2019 peak through the end of 2025, yet JLL reported that office investment transaction volume surged 42% year-over-year in the first half of 2025 — reaching $25.9 billion — with the number of bids per deal rising 50%. The distress story is real. So is the opportunity hiding inside it.
The U.S. office market is entering a new phase, one that looks less like a sector in freefall and more like a classic special-situation setup: deep value dislocation on the low end, a tightening supply pipeline creating scarcity on the high end, and capital beginning to sort through the rubble for assets that can be repositioned, converted, or simply held through the bottom of the cycle. Not every office building belongs in a portfolio. But the blanket dismissal of office as uninvestable is increasingly out of step with what the data actually shows.
The Vacancy Picture Is More Nuanced Than the Headlines
The national office vacancy rate stood at 18.6% in Q1 2026 according to CBRE, down 10 basis points from Q4 2025 and the first meaningful sign of stabilization after years of uninterrupted rise. That headline number, however, conceals a market that has split into two very different stories. The overall vacancy rate was 18.6%, but the prime vacancy rate fell to just 12.7% — a full 80 basis points lower than the prior quarter. Midtown Manhattan’s prime vacancy fell even further, to just 2.9%.
Cushman & Wakefield’s Q1 2026 data showed overall absorption was still slightly negative at -4.0 million square feet on a quarterly basis, but the four-quarter rolling total turned positive at +5.2 million square feet — the best reading since early 2020. Savills reported national office availability fell to 23.1% in Q1 2026, down from 24.8% a year earlier, with nearly 88% of tracked markets recording year-over-year declines.

Supply dynamics are accelerating the turn. CBRE noted that 2025 was the first year in which inventory removals — demolitions and conversions — outpaced new completions since the firm began tracking the market in 1988. Space under construction fell to just 18.6 million square feet in Q1 2026, the lowest level this century. New completions were down 40% year-over-year.
Sublease Space: The Hidden Progress Report
One of the clearest signs that the worst of office distress has passed is the steady decline in sublease availability. National sublease availability fell to 101 million square feet in Q1 2026, down 25% from its peak in Q1 2024 of approximately 134 million square feet, according to Cushman & Wakefield. Sublease space declined year-over-year in 52 U.S. markets. The largest reductions occurred in San Francisco, Midtown Manhattan, Dallas, San Jose, and Minneapolis/St. Paul, each with more than 1 million square feet of sublease absorbed or removed.

As sublease inventory falls, the cap on effective rents begins to lift. The market is not there yet — effective rents still lag asking rents substantially in most markets due to tenant improvement packages and free-rent concessions — but the pressure from above is clearly easing.
Markets Where Office Is Actually Ticking Back Up
Manhattan: The Bellwether Has Turned
Manhattan’s office market is in the midst of a genuine recovery. Leasing activity reached 12.9 million square feet in Q1 2026 — the strongest quarterly output since 2019 — including 8.8 million square feet in Midtown alone, a 21.5% increase year-over-year, according to Newmark’s Q1 2026 report. Overall asking rents rose to $78.25 per square foot, while Midtown Class A rents hit $88.32 per square foot. A record 313 leases signed at $100+ per square foot in 2025, and availability fell from nearly 20% to 13.2% over two years.
Miami: Sun Belt Pricing Power
Miami’s office market has become one of the tightest in the country. Annual full-service asking rents hit an all-time high of $62.45 per square foot in Q1 2026, a 4.9% year-over-year increase, according to Newmark. BNP Paribas Real Estate reported that Miami office rents surged 49% since 2020, with vacancy tightening to 11.4%.
Boston and Nashville
Boston’s CBD office market remains one of the nation’s strongest for life-science-adjacent tenants, with asking rents approximating $72 per square foot. Nashville has seen Class A asking rents climb to the low-to-mid $30s per square foot with cumulative asking rent growth of approximately 35.8% over five years, according to CoStar data cited by Partners Real Estate.

San Francisco: Still Healing, But Turning
San Francisco remains one of the most distressed major office markets, with overall vacancy at 28.0% in Q1 2026. But even there, the direction has shifted — vacancy fell 370 basis points year-over-year. Average sales prices have collapsed to around $240 per square foot, down nearly 80% from the 2019 peak. For special-situation investors, that repricing is the point of entry, not a reason to stay out.
Which Risk Profiles Still Pencil?
“We’re beginning to see a clear bifurcation: not between office and everything else, but between assets with a credible future and those without one.”
— David C. Smith, Head of Americas Insights, Cushman & Wakefield
Class A Trophy / Prime CBD: The Scarcity Play
Prime Class A office in major CBDs is the most institutionally crowded trade in office right now. CBRE expects prime vacancy to return to pre-pandemic levels of approximately 8.2% by 2027. With space under construction at generational lows, prime Class A landlords are positioned to gain meaningful pricing power within two to three years. Investment sales volume rose 20% year-over-year in Q1 2026 according to CBRE, led by high-quality assets in New York, Boston, and Miami.
“Office is no longer uninvestable. It’s bifurcated. Prime is priced to perform. What’s cheap is cheap for a reason — and you have to know which one you’re buying.”
— Green Street Advisors, 2026 Office Sector Review
Medical Office Buildings (MOBs): The Defensive Growth Play
Medical office is the clearest winner in the office adjacency space. MOB occupancy reached 92.5% nationally in 2025, with many markets above 95%, according to Colliers. MOB rents have grown an average of 2.4% per year over the past three years. CBRE projects MOB construction completions will drop another 26% in 2026, reaching decade-low levels. Institutional investment in medical office assets increased by roughly 33% over the 12 months ended March 2026, according to IPA.
“MOBs near high-traffic retail corridors and high-income areas are realizing higher rents and occupancy. The fundamentals here are as durable as any sector in CRE.”
— CBRE Healthcare Real Estate Trends, 2026
Class B to Residential Conversion: The Value-Add Thesis
Office-to-residential conversion has moved from niche strategy to mainstream institutional thesis. The number of U.S. conversion projects surged 340% between 2021 and 2026, from roughly 28 active projects to 123, with 62 million square feet under conversion, representing an estimated 44,000 future residential units, according to CBRE’s Adaptive Reuse Report. Class B and C offices in CBDs have sold at 60% to 70% discounts to replacement cost. Twenty-seven major U.S. cities now offer some form of tax abatement, zoning flexibility, or expedited permitting for conversions.
“The repricing of Class B/C office has finally made the conversion math real. Two years ago, acquisition costs were still too high. Today, in the right markets, the basis is compelling.”
— Callan Institute, 2025 Office Conversion Institutional Analysis
Boutique and Flex Office: The Optionality Play
The coworking and managed flex space market is projected to grow from $26.2 billion in 2025 to $30.1 billion in 2026, a 15% CAGR. The top 50 flex-space providers now account for 2.6% of total U.S. office inventory, and 58% of corporate occupiers use flexible space in some form. Smaller boutique office buildings — typically under 100,000 square feet, in walkable submarkets — have performed best, attracting smaller tenants who are the most active leasing cohort nationally.
Class B/C Commodity: Avoid Unless Converting
Rent growth for commodity office across all classes has risen only about 1% since 2020, well below inflation, according to Plante Moran. Unless the building has a clear conversion path or is in a genuinely supply-constrained submarket, commodity Class B and C office in non-gateway markets is likely to remain a value trap rather than a value opportunity through 2027.

The Underwriting Question: How Are Investors Positioning?
The central tension in office underwriting in 2026 is between two competing pressures. On one side, assets are cheaper than they have been in decades — office values are down 38% from the 2019 peak per Green Street’s Commercial Property Price Index, and some Class B/C assets have fallen 60–70% — making yield-on-cost calculations look attractive at the right entry basis. On the other side, the recovery timeline is genuinely uncertain, exit cap rates for office are wide, and CMBS delinquency rates remain elevated.
CBRE’s 2026 Capital Markets outlook forecasts a 16% increase in overall CRE investment volume, with office expected to see “notable volume growth” led by well-located Class A properties. Opportunistic investors are approaching distressed office, CMBS defaults, and conversion plays by underwriting to a total-cost-of-capital basis rather than to a stabilized NOI multiple, targeting internal rates of return in the 15–20% range through basis arbitrage.
“The office market is past the bottom. The headline vacancy rate will stay elevated for another year because the denominator takes time to adjust. But the fundamentals have already turned.”
— Terrain Intelligence, Q1 2026 Market Intelligence Report
“The risk for operators and lenders isn’t continued decline. It’s waiting for all-clear signals that show up 6–12 months after the opportunity has priced in.”
— Terrain Intelligence, Q1 2026
“Office is a special situation play now, not a core one. The discipline is in asset selection and basis — not in hoping the whole market comes back.”
— Gen3 Development, Distressed Real Estate Outlook 2026
The Structural Tailwinds That Markets Are Underpricing
Return-to-office mandates are real and accelerating. Q1 2026 office leasing nationally hit its highest quarterly level since mid-2018 at approximately 120 million square feet, up 25% year-over-year. Three days per week appears to be the new steady state for hybrid work, and that stability is enabling occupiers to make long-term leasing decisions they had been deferring.
The supply pipeline is collapsing to historic lows. Space under construction at 18.6 million square feet is the lowest this century. New completions were down 40% year-over-year. That is a structural demand-supply rebalancing that does not require a demand surge — it just requires demand to stay flat while supply falls.
Debt maturity pressure is creating forced selling at distressed prices. Between now and the end of 2026, nearly $1.8–$2.0 trillion of CRE debt matures, much of it written at low rates that cannot be replaced on anything like the same terms. Well-capitalized investors without legacy basis issues are positioned to acquire assets at prices that were simply not available two years ago.
5 Questions To Screenshot Before Deploying Into Office
- What is the total-cost basis, and does the yield-on-cost work at today’s market rents — not at projected rents?
- Is there a credible conversion, repositioning, or lease-up path, and have you validated the regulatory timeline and cost stack?
- What does the submarket’s supply pipeline look like over the next three years, and is this asset competing with new construction or just with itself?
- What is the debt maturity and financing cost, and can the asset service its debt at a stressed occupancy of 60–70%?
- Is the investment thesis driven by market recovery, or does it pencil on a standalone asset-level basis even if the broader office market stays soft?
Final Take
Office 2.0 is not a story about office coming back. It is a story about sorting. The market has repriced violently and indiscriminately — which is exactly the environment that produces special-situation returns for investors who can do the asset-level work that broad market indices cannot. Medical office is a secular winner. Trophy prime is a scarcity play with institutional backing. Class B conversion is a value-creation trade requiring execution skill. Boutique flex is a cash-flow story for patient operators. Commodity Class B and C without a conversion path is the one to avoid.
The investors who will win in this cycle are not the ones waiting for office to be universally declared safe again. By then, the basis advantage will be gone. The opportunity is available now, in specific assets, in specific markets, for investors willing to do the work that the distress story has scared away.